
Thermal
Inversion and its Relationship with Jojoba
Cultivation in the Ecotone
between the Arid
Chaco and the Mountain
Chaco, Argentina
Inversión Térmica y su Relación
con el Cultivo de Jojoba
en el Ecotono entre el Chaco Árido y el Chaco Serrano,
Argentina
Ricardo Ayerza
The University of Arizona, Tucson,
Arizona 85706, U.S.A. - Universidad Regional Amazónica IKIAM, Tena, Ecuador.
rayerza@newcrops.org
Abstract
Jojoba
plants were tested for three years. They were planted
in three plots in the western
hillside of the Sierra de Pocho, Córdoba,
Argentina. The EC-El Cerro,
JI-Jardín de Introducción and LQ-La Quebrada plots were located
at 360, 400 and 550 masl. respectively. Minimum extreme temperatures were -1,
-3 and -6 °C for LQ, JI and EC, respectively. EC plants died in the first year due to low temperatures. Altitude and extreme minimum temperatures of May, June, July and August
had a significantly high positive
correlation (0.733; P<0.05). The production of LQ was significantly (P<0.05) higher than that of
JI with 759 and 401 g/plant respectively. The seed weight of JI was significantly (P<0.05) higher than that of LQ with 0.85 and 0.76 g/seed respectively. Wax content was 51.4% (JI) and 51.1% (LQ). The wax content
of LQ seeds varied significantly (P<0.05) between 40.6 and 55%. The presence
of the atmospheric phenomenon of autumn-winter thermal
inversion in the Sierra
de Pocho foothills was determined as the factor of the persistence and production of jojoba.
Keywords: Seeds; Simmondsia chinensis; Temperature; Wax.
Resumen
Se testearon plantas
de jojoba durante
tres años. Fueron sembrados en tres parcelas en la ladera
occidental de la Sierra de Pocho, Córdoba,
Argentina. Las parcelas EC-El Cerro, JI-Jardín de Introducción y LQ- La Quebrada
se ubicaron a 360, 400 y 550 msnm respectivamente. Las temperaturas mínimas
extremas fueron -1, -3 y -6 °C para LQ, JI y EC, respectivamente. Las plantas de EC murieron el primer año debido
a las bajas temperaturas. La altitud y las temperaturas mínimas extremas de mayo, junio, julio y agosto tuvieron una correlación positiva
significativamente alta (0,733; P<0,05). La producción de LQ fue significativamente (P<0,05) mayor que la de JI con 759 y 401 g/planta respectivamente. El peso de la semilla de JI
fue significativamente (P<0,05) mayor que el de LQ con 0,85
y 0,76 g/semilla respectivamente. El contenido
de cera fue de 51,4% (JI) y 51,1% (LQ). El contenido
de cera de las semillas LQ varió significativamente (P<0,05) entre 40,6 y 55%. Se determinó que la presencia
del fenómeno atmosférico de inversión térmica otoñal-invernal en las estribaciones de la Sierra
de Pocho era el factor de la persistencia y producción de jojoba.
Palabras clave: Cera; Simmondsia chinensis; Semillas;
Temperaturas.

Ayerza R. (2026). Thermal Inversion and its Relationship with Jojoba Cultivation in the Ecotone Between the Arid Chaco and the Mountain Chaco,
Argentina. Revista Ciencias Naturales
4(1), 10-25.
 Recibido: 30/12/2025 Aceptado: 31/3/2026 Publicado: 31/7/2026 Editor: Olga Martínez
INTRODUCTION
Jojoba
wax, produced from the Simmondsia chinensis (Link) C.K. Schneid.
plant, is a raw material
for the cosmetics and precision instruments industries. Its market has grown
since the second half of the last century. This led to ambitious projects
of planting that failed due to the lack of adaptation outside
its area of origin, viz., Brazil, Costa Rica, Madagascar, Paraguay, Sudan, etc. The lack of information about regions suitable for production and the long time it takes to obtain yields have led to
discouraging its cultivation, while demand continues to grow without being
able to be satisfied. Today, the jojoba market
is estimated at US$130.8
million per year mainly shared between the cosmetology, pharmacy and precision instruments industries (Grand View Research, 2023). In 2022, 18,211 tons of wax were sold and a growth
of 6.6% is expected between
2023 and 2028 (IMARC
Group,
2023).
The jojoba crop was introduced in Argentina
in 1976 at El Desafío farm located in the Sierra de Pocho foothills, Córdoba.
The place is an ecotone
between the Mountain Chaco and the Arid Chaco (Ayerza, 1990a).
Today, Argentina has 2,455 commercial hectares, concentrated in the Arauco Depart- ment, La Rioja Province
(Ayerza, 2020a;
N. Vinelli, Aimogasta, La Rioja, personal
com- munication 2025). However, it reached 13,000 hectares with commercial expectations, most of which they never produced
due to the lack of adaptation of the species to the selected places (Coates & Ayerza,
2008). Planting si- tes included
Capital Department (La Rioja), Valle de Catamarca (Catamarca) and Las Col-
menas (Salta). Experimental plots were also established in Fuerte Esperanza (Chaco), Ing. Juárez
(Formosa), San Martín (Mendoza) and Burruyacú (Tucumán).
This lack of adaptation
was essentially due to thermal conditions. The minimum temperatures in areas such as San Martín,
Mendoza (Monte
Desert) and Department Capital, La Rioja (Arid Chaco) eliminated the flowers and even killed
the young plants.
In the Semiarid Chaco such as Tucumán,
Salta and Formosa, the lack of enough winter cold
did not allow the vernalization phenomenon thus inhibiting the beginning
of the floral opening period (Ayerza,
1990a, 1992).
Between 2013 and 2017, Argentina
was the main jojoba producer
in the world. It was then displaced to third place by Israel
and Peru due to increased yields and increased
planted areas in both countries. The determination of new areas suitable for the crop, together with the availability of higher production clones could allow the country to retrieve positions in the market.
The Since 1990,
the production area has remained
constant (N. Vinelli,
Aimogasta, La Rioja, personal
communication, 2025). This area in the Arauco Department, La Rioja
Province, could extend
to the west, ascending on the foothill
of the Sierra de Velazco, taking advantage of the winter thermal inversion phenomenon. There, the increased production of jojoba plants as altitude increases has been
determined. In the center of the valley, the extreme
minimum temperatures can reach
-9°C (Ayerza,
1990a).
In these
regions, the low rainfall (100
to 150 mm/year) on the slopes suitable for cultivation is an important limitation, so it is essential
to resort to irrigation. The water tables are 200 m deep, with flows of 150 to 200 m3/hour. To obtain higher flows and structural
stability of the perforations it is necessary
to reach 400 to 440 m deep. This implies very important
infrastructure and pumping
costs that put at
risk the economic results of the plantations (Tálamo et al., 2013).
On the other hand,
the decrease in water resources is forcing the world to pay attention to the use of water. The decrease in groundwater and its flows due
to the overexploitation of aquifers, as well as the destruction of vegetation and tree cover that exacerbates soil erosion and reduces groundwater recharge, increases water scarcity and food insecurity (United Nations,
2019).
A basic factor for expanding jojoba cultivation in the country and ensuring sustainability is to find thermally suitable
areas for cultivation with adequate rainfall regimes,
using irrigation only as strategic support.
Based on the recent
determination of the thermal inversion phenomenon in the Sierras de Pocho, Córdoba, Argentina (Ayerza, 2023),
this paper is aimed to define its relationship
with the productive jojoba behavior in the said ecosystem
and under rainfed conditions. Even though the presented data were obtained between
1980 and 1986, the conclusions of the study were never published. Knowing the behavior
of the species and the essential edaphoclimatic characteristics of the region,
would allow adding an area to establish more sustainable commercial jojoba projects
than the current
ones, by not having to resort to irrigation.
MATERIALS AND METHODS
The work was carried
out at El Desafío farm, located
on the western slope of the Pocho Mountain, Pocho, Córdoba,
Argentina. The place belongs
to the so-called Eastern
Pampa Mountains.
Seeds to be planted
were harvested in July 1980, from a hillside exposed
to the north of the Tucson
Mountains, Tucson, Arizona (32°14’13” N and 111°02’55” W) between
778 and 810 masl, with a slope of 25.6%.
Plants density was 0.21 plants/m2 with a male- to-female
ratio of 46.55% of male plants and 51.72% of female plants,
which suggests a significant variability in the seed’s genetic
composition (Ayerza, 2025).
Seeds from 10 plants selected
at random two years
earlier were harvested (Tables
3 and 4). These plants had been identified
and monitored and their annual fruiting was observed
(Ayerza, 1984). Later on, between 1981 and 1984, the floral
biology of this jojoba
stand was studied
confirming a significant variability among individuals
(Buchmann, 1987).
Winter
thermal inversion phenomenon was determined in the Tucson
Mountains hillsides where the native jojoba plants grow (Shreve, 1912; U.S. Army Corps of Engineers, 1997).
This explains this species’
presence on the hillside as well as their absence in the center
of the valleys (Ayerza,
1990a).
The seeds were brought
to Argentina where three random samples
were taken after mixing
them. In October
1980, three plots were planted in a western hillside
of the Sierra de Pocho, in an ecotone between the Arid Chaco and the Mountain
Chaco, at 31°64’ south latitude. The EC (El Cerro) plot was located at 360, the JI (Jardín de Introducción) plot was located at 400 masl and LQ (La Quebrada) plot was located at 550 masl.
The distance
between LQ and JI was 2,404 m and between
JI and EC, 1,649 m. The slope percentage was 4.16 and 2.43 for LQ and JI respectively. The description of the measurement instruments placed in each site for the collection of temperature and rainfall
data for the period 1983-1986
were described by Ayerza (2023).
To determine possible differences between
the soils of the plots, a chemical analysis
of composite samples
from each plot, taken in the first 40 cm of depth, was carried out. The
method used was Mehlich 3 (Mehlich, 1984)
for calcium, magnesium, potassium and sodium; that of Bray & Kurtz (1945) for phosphorus; that of Kjeldahl
for nitrogen (Chapman & Pratt, 1961) and that of Walkley- Black for organic matter and carbon (Walkley
& Black, 1934).
The pH was determined by
electrometric method (Bates,
1973).
The planting
framework was one seed
per meter in the row, and four meters
apart between them. The seeds were soaked for 48 hours
before planting and only those that were swollen were planted.
The plots were irrigated
by furrow only during the first month and no fertilizer were applied during the analyzed years. When the plants were three years old, 43 female
plants were randomly selected in LQ and 22 in JI, being 50% of the total female plants of each plot. The selected plants were within the rows, discarding the edges with a male-to-female ratio being 1:1 in each plot. In the
EC plots no plants were chosen
since they disappeared before they were three years old due to the extremely
low temperatures.
Every year, between
November and January,
the seeds were manually collected. The followingApril, they
were cleaned, dried in the shade and weighed.
In all cases, the weight had 4% moisture,
using for its determination a Delver HD-1021 meter
(Delver S.A., La Plata, Buenos
Aires, Argentina).

 The seeds were stored
at room temperature until 1988, when the liquid wax content
was determined. Seeds from seven plants were taken at random from the QL site and since
after the physical determinations the JI seeds were mixed, two composite samples (JI and JI) were taken
for analysis. The determination was done through the AOCS Ac-3-44
(AOCS, 1984) method at the laboratory of Jojoba Growers
and Processors Inc., Apache Junction, Arizona, US.
The seeds were stored
at room temperature until 1988, when the liquid wax content
was determined. Seeds from seven plants were taken at random from the QL site and since
after the physical determinations the JI seeds were mixed, two composite samples (JI and JI) were taken
for analysis. The determination was done through the AOCS Ac-3-44
(AOCS, 1984) method at the laboratory of Jojoba Growers
and Processors Inc., Apache Junction, Arizona, US.
The information
collected in this experiment was
analyzed in 2022. The statistical determinations (Standard Deviation, Multiple Comparison of Means and
Correlations) were carried out using the CoStat software (CoHort
Stat, 2006).
I was not used in the
preparation of this paper.
RESULTS AND DISCUSSION
Table
1 shows the soils chemical composition of the EC, JI and LQ plots and Tucson hillside where the plants from which the original
seeds were collected.
The soils of the three trial plots were chemically very similar
to each other, being
typical of the region (Hang et al.,
1995; Bocco et al., 2007;
Karlin, 2013). Therefore, an influence of this factor
between the implanted sites was ruled out. All the values obtained
were within the limits of the Sonora Desert and Californian Mediterranean soils, where the native jojoba stands are located
(Ayerza, 2025). However, the Tucson soil presented
a lower pH, a lower organic
matter content, a lower calcium
content and more phosphorus
than the soils of the trial.
The data of the soils in which the jojoba crop is successfully developed show that the differences between the Tucson soils and those of the trial are not sufficient to interfere in their development
(Gentry, 1958; Brooks, 1978; Ayerza,
1990a).
Table
2 shows the extreme temperatures recorded during the studied
years. The plants from the EC plot were strongly affected
by low temperatures, most of them dying at temperatures of -6°C. The remaining plants died between 1984 and
1985 with temperatures of up to -5 and -6°C without any producing, so the EC plot had to be left aside. Although adult jojoba plants
can survive extreme minimum
temperatures of -9.5°C,
young plants die with
|
Site
|
pH
|
C
|
MO
%
|
N
|
Ca
|
Mg
|
K
mg/100 g of soil
|
Na
|
P
|
C/N
ratio
|
|
LQ
|
7.6
|
1.05
|
2.10
|
0.099
|
370
|
30
|
89
|
3
|
0.8
|
10.6
|
|
JI
|
7.6
|
1.10
|
2.20
|
0.093
|
380
|
60
|
87
|
3
|
1.08
|
11.8
|
|
EC
|
7.8
|
1.25
|
2.50
|
0.096
|
290
|
36
|
89
|
3
|
0.96
|
13.1
|
|
Mean
|
7.7
|
1.1
|
2.3
|
0.1
|
346.7
|
42.0
|
88.3
|
3
|
0.9
|
11.8
|
|
SD1
|
0.12
|
0.10
|
0.21
|
0.00
|
49.33
|
15.87
|
1.15
|
0.00
|
0.14
|
1.25
|
|
Tucson2
|
6.6
|
0.45
|
0.90
|
0.051
|
160
|
48
|
16
|
3
|
5.76
|
8.8
|
1 Standard Deviation; 2 hillsides where the original seeds were collected.

Table 1. Soils chemical composition of the EC, JI, LQ plots in the
Sierra de Pocho foot
hills, Córdoba, Argentina
|
Month
|
J
|
F
|
M
|
A
|
M
|
J
|
J
|
A
|
S
|
O
|
N
|
D
|
SD
|
Mean
|
|
Absolute minimum temperature(°C)
|
|
LQ-83
|
12.70
|
15
|
12
|
13
|
-1
|
-1
|
1
|
4
|
3
|
7
|
12
|
16
|
6.36
|
7.81
|
|
LQ-84
|
18
|
13
|
12
|
7
|
1
|
1
|
1
|
1
|
4
|
6
|
10
|
7
|
5.59
|
6.75
|
|
LQ-85
|
10
|
14
|
8
|
6
|
5
|
1
|
-1
|
-1
|
4
|
6
|
10
|
10
|
4.71
|
6.00
|
|
SD1
|
4.07
|
1
|
2.31
|
3.79
|
3.06
|
1.15
|
1.15
|
2.52
|
0.58
|
0.58
|
1.15
|
4.58
|
-
|
-
|
|
Mean
|
13.60
|
14
|
10.70
|
8.70
|
1.70
|
0.30
|
0.30
|
1.30
|
3.70
|
6.30
|
10.70
|
11
|
5.60
|
6.90
|
|
JI-83
|
19
|
17
|
12
|
13
|
-3
|
-3
|
0
|
3
|
0
|
6
|
12
|
16
|
8.09
|
7.67
|
|
JI-84
|
13
|
17
|
10
|
5
|
-1
|
2
|
3
|
-3
|
4
|
9
|
7
|
11
|
5.87
|
6.42
|
|
JI-85
|
8
|
10
|
7
|
0
|
3
|
-2
|
-2
|
0
|
3
|
6
|
11
|
12
|
5.03
|
4.67
|
|
SD
|
5.51
|
4.04
|
2.52
|
6.56
|
3.06
|
2.65
|
2.52
|
3.00
|
2.08
|
1.73
|
2.65
|
2.65
|
-
|
-
|
|
Mean
|
13.33
|
14.67
|
9.67
|
6
|
-0.33
|
-1
|
0.33
|
0.00
|
2.33
|
7
|
10
|
13
|
6.33
|
6.25
|
|
EC-83
|
16
|
16
|
12
|
2
|
-4
|
-6
|
0
|
2
|
0
|
4
|
14
|
18
|
8.50
|
6.17
|
|
EC-84
|
19
|
18
|
10
|
4
|
-5
|
-3
|
-4
|
-5
|
4
|
7
|
7
|
9
|
8.32
|
5.08
|
|
EC-85
|
10
|
9
|
7
|
-3
|
-3
|
-6
|
-5
|
-4.5
|
0
|
7
|
10
|
11
|
6.82
|
2.71
|
|
SD
|
4.58
|
4.73
|
2.52
|
3.61
|
1
|
1.73
|
2.65
|
3.91
|
2.31
|
1.73
|
3.51
|
4.73
|
-
|
-
|
|
Mean
|
15
|
14.30
|
9.70
|
1
|
-4
|
-5
|
-3
|
-2.50
|
1.30
|
6
|
10.30
|
12.70
|
7.90
|
4.70
|
|
1 Standard Deviation
|
Table 2. Absolute minimum
temperature by site and year.
extreme minimum temperatures between
-4 and -5°C (Gentry,1958; Yermanos, 1982; Nelson & Palzkill,
1993). In addition to the differences in the extreme
minimum temperatures of the studied period,
there were also differences in the number of months with frosts, being 11, 6 and 4 for EC, JI and LQ, respectively (Table 2).
The Fig. 1 shows the curves
of the mean extreme minimum, mean extreme maximum
and mean annual temperatures for the period 1983-1985 at the three surveyed
sites. This graph allows
us to observe the presence
of the atmospheric phenomenon of thermal inversion
during autumn-winter (May, June, July and
August), responsible for the increase
in extreme minimum temperatures as altitude increases, as reported for the 1983-1986 period (Ayerza, 2023).
This same behavior
regarding altitude and minimum winter temperatures was
determined in the northern Sonoran Desert, on a slope with native jojoba in Cave Creek, Arizona, USA, between
the base 610 masl and 730 masl (Burden, 1970).
The extreme minimum temperatures of May, June, July and August
(Fig. 2) and the altitude
between 360 and 550 masl, presented a significantly high positive correlation (0.733; P<0.05).
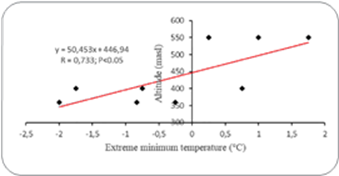
Figure 1. Correlation of the extreme minimum temperature of May, June, July and August versus altitude.
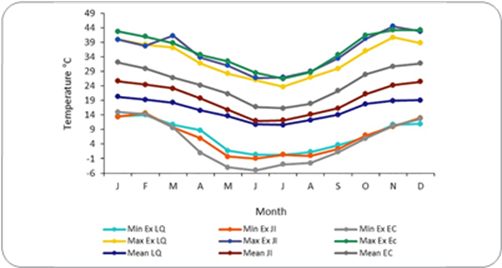
Figure 2. Extreme minimum, extreme maximum and annual mean temperatures for the period 1983-1985 at the three surveyed
sites.
According to Ayerza (2004), the jojoba flowering period in the ecotone between
the Mountain Chaco and the Arid Chaco forms a Gaussian curve that begins in mid-June
and lasts until mid-September, coinciding this extension
of the floral period with that of
the original population (Buchmann, 1987). This long flowering period is made up of two
essential aspects: variability of the flowering beginning of the different
genotypes and extended opening
period in the same plant. It has been
shown that the beginning of flowering
depends on the vernalization requirement of each genotype (Ferriere et al., 1989; Benzioni
et al., 1992; Dunstone,
1995; Milthorpe, 2006), as well as the length of the opening
period (Dunstone, 1980;
Nerd & Benzioni, 1988),
and in both cases of their interactions with climatic conditions.
In the foothills of the Sierra de Ancasti,
Catamarca, Argentina, an ecotone between
the Mountain Chaco and the
Arid Chaco, the individual flowering
period has been determined between 20 and 46 days to reach 90%
of floral opening,
depending on the genotype and weather
conditions (Ayerza,
2004). Although
the same clone controlled in this foothill
for two consecutive years, presented a similar flowering
period of 27 days,
between August 20 and September 17, and 24 days, between
September 8 and October 2, the following year, the start date presented
a difference of 19 days (Coates & Ayerza, 2008).
The variation between
years in the beginning and length of flowering has been
determined in other jojoba populations with similar
values (Nahla et al., 2018; Perry et al., 2021).
Since
freezing in plants is a progressive process, the duration
of freezing temperatures is a decisive factor (Díaz-Queralto, 1971; Livingston, 2018; Bravo et al., 2020).
The frequency variability of wild jojoba plants is influenced by changes in slope angle (Burden,
1970); the steeper the slope,
the shorter the duration of the frost (Snyder & Melo- Abreu, 2005).
In the northern Sonoran Desert, in the mountains of Cave Creek, Arizona, a highly
significant positive correlation (R = 0.524; P<0.01) was demonstrated between the presence
of this plant and the slope angle. Its degree is closely linked,
not only with the
circulation of the air, but also with its speed and, therefore, with the duration of the low temperatures (Burden,
1970).
The slope in LQ was
4.16% while in JI it was 2.43%, so the duration of the low temperatures must necessarily have been
shorter in LQ than in JI, which must also have influenced the differences between
the plant yields of both sites. Tables 4 and 5 show the individual weights of the seeds and the yields per plant of the LQ and JI sites during the three years studied.
|
Plant
|
Weight (g/seed)
|
Yield (g/plant)
|
|
|
1983
|
1984
|
1985
|
Media
|
1983
|
1984
|
1985
|
Total
|
|
Q P
7
11
|
0.79
|
0.92
|
0.73
|
0.81
|
4.0
|
272.0
|
115.4
|
391.3
|
|
Q P
7
12
|
0.77
|
0.88
|
0.71
|
0.79
|
4.6
|
268.4
|
206.6
|
479.6
|
|
Q P
4
4
|
0.89
|
0.83
|
0.71
|
0.81
|
7.1
|
243.2
|
117.9
|
368.3
|
|
Q P
6
9
|
0.48
|
0.75
|
0.76
|
0.66
|
6.8
|
290.0
|
241.5
|
538.3
|
|
Q P
4
8
|
0.79
|
0.89
|
0.62
|
0.77
|
346.0
|
644.5
|
814.7
|
1,805.2
|
|
Q P
4
3
|
0.63
|
0.85
|
0.68
|
0.72
|
23.4
|
349.3
|
1,087.1
|
1,459.8
|
|
Q P
7
2
|
0.89
|
0.87
|
0.69
|
0.82
|
8.0
|
226.8
|
198.7
|
433.5
|
|
Q P
9
9
|
0.93
|
0.90
|
1.01
|
0.95
|
10.2
|
266.0
|
307.9
|
584.1
|
|
Q P
6
10
|
0.58
|
0.88
|
0.78
|
0.75
|
27.8
|
442.0
|
1,088.3
|
1,558.1
|
|
Q P
5
15
|
0.22
|
0.88
|
0.67
|
0.59
|
35.7
|
464.3
|
1,140.3
|
1,640.3
|
|
Q P
4
1
|
0.63
|
0.78
|
0.70
|
0.70
|
6.9
|
170.0
|
150.4
|
327.3
|
|
Q P
3 2
|
0.59
|
0.88
|
0.74
|
0.74
|
31.7
|
208.0
|
1,284.2
|
1,523.9
|
|
Q P
4 16
|
0.72
|
0.68
|
0.53
|
0.64
|
22.9
|
324.6
|
518.7
|
866.3
|
|
Q P
11 12
|
0.63
|
0.86
|
0.72
|
0.74
|
24.5
|
212.6
|
834.9
|
1,072.0
|
|
Q P
4
2
|
0.60
|
0.83
|
0.65
|
0.69
|
22.1
|
359.2
|
283.4
|
664.8
|
|
Q P
5
17
|
1.12
|
0.88
|
0.88
|
0.96
|
17.9
|
390.6
|
223.5
|
632.1
|
|
Q P
9
7
|
0.56
|
0.91
|
0.67
|
0.71
|
15.7
|
234.0
|
371.0
|
620.6
|
|
Q P
8
3
|
0.59
|
0.85
|
0.73
|
0.72
|
8.3
|
155.3
|
142.7
|
306.2
|
|
Q P
4 10
|
0.96
|
0.74
|
0.60
|
0.77
|
67.1
|
534.0
|
560.7
|
1,161.8
|
|
Q P
6 13
|
0.68
|
0.88
|
0.66
|
0.74
|
56.1
|
492.8
|
570.3
|
1,119.3
|
|
Q P
5 8
|
0.62
|
1.01
|
0.67
|
0.77
|
99.2
|
290.0
|
1029.7
|
1,418.9
|
|
Q P
3
10
|
0.46
|
0.82
|
0.56
|
0.61
|
41.8
|
315.5
|
525.2
|
882.5
|
|
Q P
3
14
|
0.77
|
0.84
|
0.82
|
0.81
|
81.6
|
319.6
|
186.7
|
587.9
|
|
Q P
3
8
|
0.64
|
0.84
|
0.66
|
0.71
|
44.1
|
351.9
|
469.4
|
865.4
|
|
Q P
11 9
|
0.86
|
0.86
|
0.70
|
0.81
|
18.9
|
184.0
|
477.8
|
680.7
|
|
Q P
5 5
|
0.58
|
0.88
|
0.66
|
0.71
|
23.2
|
242.2
|
415.3
|
680.7
|
|
Q P
3 13
|
0.61
|
0.80
|
0.84
|
0.75
|
7.9
|
138.9
|
274.8
|
421.6
|
|
Q P
3 3
|
0.77
|
0.77
|
0.70
|
0.75
|
17.0
|
221.9
|
372.8
|
611.7
|
|
Q P
3
7
|
0.59
|
0.78
|
0.67
|
0.68
|
300.2
|
559.6
|
556.7
|
1,416.5
|
|
Q P
5
18
|
0.82
|
0.87
|
0.86
|
0.85
|
58.9
|
299.1
|
656.0
|
1,014.0
|
|
Q P
5 16
|
0.77
|
0.85
|
0.64
|
0.75
|
11.5
|
176.9
|
292.9
|
481.3
|
|
Q P
3 5
|
0.77
|
0.87
|
0.70
|
0.78
|
138.0
|
288.6
|
776.4
|
1,203.0
|
|
Q P
3
6
|
0.60
|
0.79
|
0.73
|
0.71
|
15.1
|
163.6
|
390.9
|
569.6
|
|
Q
1
|
0.52
|
0.67
|
0.75
|
0.65
|
25.4
|
76.0
|
420.5
|
521.9
|
|
Q P
3
20
|
0.74
|
0.89
|
0.70
|
0.78
|
24.5
|
247.5
|
166.9
|
438.9
|
|
Q P
5
12
|
0.79
|
0.87
|
0.84
|
0.83
|
25.4
|
214.4
|
224.0
|
463.8
|
|
Q P
1
6
|
0.85
|
0.93
|
0.96
|
0.91
|
27.2
|
187.7
|
299.3
|
514.2
|
|
Q P
3
17
|
0.78
|
0.85
|
0.74
|
0.79
|
28.9
|
242.0
|
182.0
|
452.9
|
|
Q P
4
17
|
0.63
|
0.64
|
0.62
|
0.63
|
19.6
|
163.1
|
142.2
|
324.8
|
|
Q P
2
5
|
0.90
|
0.80
|
0.71
|
0.80
|
55.5
|
177.2
|
183.4
|
416.1
|
|
Q P
2
10
|
0.71
|
0.87
|
0.90
|
0.83
|
32.8
|
163.6
|
326.9
|
523.3
|
|
Q
3
|
0.57
|
0.67
|
0.68
|
0.64
|
18.3
|
91.5
|
220.6
|
330.5
|
|
Q P
1
2
|
0.77
|
0.94
|
0.97
|
0.89
|
13.1
|
76.1
|
156.9
|
246.2
|
|
Mean
|
0.70
|
0.84
|
0.73
|
0.76
|
43.60
|
272.99
|
441.99
|
758.59
|
|
SD1
|
0.16
|
0.08
|
0.10
|
0.084
|
68.10
|
127.88
|
314.65
|
426.18
|
|
1 Standard Deviation
|
Table 3. Seeds weight
and yield of plants
from LQ site.
Table 3 shows that 30.1% of the LQ plants
reduced their production between 1984 and 1985, compared to only one (5%) in the JI.Ayerza.final_archivos/image010.png)
.Ayerza.final_archivos/image011.png) (Table 4). In this last site, the J P plant
was
(Table 4). In this last site, the J P plant
was
the only one between both sites that reduced its production between 1983 and 1984. Works have been reported in which many jojoba genotypes
present the characteristic called alternation, which implies
productive alternation, which in many cases becomes very pronounced both in commercial plantations and in native
plants (Yermanos
& Duncan, 1976; Yermanos,
1982; Perry et al., 2021). This phenomenon is common in other crops such as olive (Olea europaea L.),
juniper (Juniperus thurifera
L.), pecan (Carya illinoensis [Wangenh]
K. Koch) and various
fruit trees. (Medina-Morales et al., 2000; Ramírez-Santa Paul, 2001; Montesinos-Torres, 2007).
The alternating or biennial
production is a widely distributed phenomenon that is repeated in the different
production areas and the
metabolic processes and their induction are still only partially known.
(Lavee, 2007; Kour et al., 2018; Wünsche,
2021). It has recently been shown in jojoba that, depending
on the genotype and the type of pruning applied,
the alternation phenomenon can be significantly reduced (Lazare
et al., 2021).
However, Table 3 shows that 69.8% of
the LQ plants did not present
alternation, and Table 4 shows that 96% of JI plants
|
Plant
|
Weight (g/seed)
|
Yield (g/plant)
|
|
|
1983
|
1984
|
1985
|
Media
|
1983
|
1984
|
1985
|
Total
|
|
J P
3 22
|
---
|
0.90
|
1
|
0.95
|
---
|
1125.1
|
261.2
|
1386.3
|
|
J P
4 5
|
0.74
|
0.86
|
0.99
|
0.86
|
182.3
|
235.8
|
340.8
|
759.0
|
|
J P
4 14
|
0.81
|
0.97
|
0.98
|
0.92
|
81.5
|
110.1
|
225.4
|
416.9
|
|
J P
3 20
|
0.67
|
0.74
|
0.90
|
0.77
|
15.5
|
140.6
|
263.3
|
419.4
|
|
J P
3 11
|
0.64
|
0.82
|
0.99
|
0.82
|
5.8
|
47.5
|
155.7
|
209.0
|
|
J P
3 1
|
0.83
|
0.86
|
0.70
|
0.80
|
59.7
|
197.3
|
273.7
|
530.7
|
|
J P
3 8
|
0.77
|
0.94
|
1.01
|
0.91
|
50.8
|
111.8
|
258.5
|
421.1
|
|
J P
2 9
|
0.88
|
0.93
|
0.99
|
0.93
|
49.3
|
69.0
|
161.6
|
279.9
|
|
J P
3 5
|
0.65
|
0.74
|
0.77
|
0.72
|
21.5
|
117.7
|
239.7
|
378.9
|
|
J P
2 8
|
0.85
|
0.95
|
0.92
|
0.91
|
113.3
|
206.8
|
320.7
|
640.8
|
|
J P
4 2
|
0.69
|
0.77
|
1.01
|
0.82
|
22.0
|
75.5
|
145.0
|
242.5
|
|
J P
4 21
|
0.58
|
0.92
|
0.97
|
0.82
|
12.2
|
96.9
|
183.9
|
293.0
|
|
J P
4 6
|
0.78
|
0.94
|
0.91
|
0.88
|
110.8
|
211.7
|
297.6
|
620.1
|
|
J P
4 14
|
0.81
|
0.82
|
1.00
|
0.88
|
10.5
|
59.1
|
137.0
|
206.7
|
|
J P
3 16
|
0.93
|
0.75
|
1.00
|
0.89
|
14.8
|
67.7
|
150.4
|
232.9
|
|
J P
2 10
|
0.88
|
0.82
|
0.85
|
0.85
|
33.5
|
69.2
|
143.0
|
245.7
|
|
J P
4 7
|
1.05
|
0.54
|
0.98
|
0.86
|
45.3
|
40.6
|
184.3
|
270.3
|
|
J P
4 20
|
0.86
|
0.93
|
0.79
|
0.86
|
30.1
|
80.8
|
173.9
|
284.8
|
|
J P
3 19
|
0.88
|
0.70
|
0.95
|
0.84
|
29.0
|
41.9
|
131.2
|
202.1
|
|
J P
3 13
|
0.82
|
0.81
|
0.97
|
0.87
|
27.2
|
75.5
|
155.6
|
258.2
|
|
J P
2 12
|
0.85
|
0.82
|
0.94
|
0.87
|
35.7
|
61.8
|
161.2
|
258.7
|
|
J P
4 3
|
0.54
|
0.62
|
0.93
|
0.70
|
30.3
|
68.0
|
120.4
|
218.6
|
|
Mean
|
0.79
|
0.83
|
0.93
|
0.85
|
46.72
|
150.47
|
203.82
|
398.89
|
|
SD
|
0.12
|
0.11
|
0.09
|
0.06
|
43.17
|
225.42
|
67.01
|
271.26
|
|
1 Standard Deviation
|
Table 4.
Seed weight and
yield of plants from the JI site
did not present this characteristic either. The presence of plants with and without
alternation was identified in plantations
carried out in Riverside, California, both within plots with wild seeds originating from the coast and the inland of the Californian Mediterranean ecosystem (Yermanos, 1982),
in Mesa, Arizona,
with seeds from wild plants originating in Arizona,
California and Baja California, and in cultivated plants from Israel; 90% of plants showed productive alternation (Palzkill & Hogan, 1982). In Hermosillo, Sonora, Mexico,
210 plants were studied for four years, determining 49.7% of plants with alternate production (Durazo, 1982). The alternate production regarding the number of inflorescences has also been reported in male
jojoba plants (Tel-Zur et al., 2020).
With the information available here, it is not possible
to determine the reasons for the
differences in the percentages of alternation between the LQ and JI plants, but it could be related to the interactions between genetics and the environment, especially with the differences in extreme minimum
temperatures between both sites (Table 2). From the genetic
point of view, it should be kept in mind that the
10 plants from which the original
seeds were collected
had annual production determined, but since these were not measured,
we do not know if they were productions with or without
annual ups and downs. It should
be added that jojoba has separate
sexes and in the same plant the different seeds can have different male parents, making up a high genetic
variability between the used seeds.
The values of the standard
deviation of the total produced
in the tested period (Tables 3 and 4) show a greater dispersion of the yields among the LQ plants than among the JI ones. The extreme minimum temperatures when damaging flowers,
both closed at -3°C and open at -1°C, prevent
expressing the productive potential of many genotypes (eg. the occurrence of -1°C in early flower openings), standardizing mean production from the JI site. The standard
deviation values show that for the LQ site a clonal selection process would be much more efficient
than in the JI. Likewise, the reduced magnitude
of the standard deviation
of the plants from the JI site could indicate
that these genotypes
are at the limit of their adaptation zone as suggested by Ayerza & Zeaser (1986).
Table
5 shows that despite the high percentage of biennial plants in the LQ plot, the
production per area unit increased
every year. This characteristic of a high number of alternations, but with an annual increase in total production per area unit, was previously reported
in experimental and commercial
plantations in Mesa, Arizona, US, and in Bakersfield, California, US (Palzkill & Hogan, 1982). The annual increase
in the production of the
non-alternation plants compensated the decrease of the alternation plants, in the yields
per area unit.
Table
5 shows that the mean
production of both sites increased significantly (P<0.05) with age, except for the JI site between 1984 and 1985 which, although numerically increased, the difference was not statistically significant (P<0.05). These annual yields increase is the usual
result for numerous
species and within
them among genotypes that do not present
the phenomenon of alternation; in developing
|
|
Site
|
1983
|
1984
g/plant
|
1985
|
LSD2
|
Total
g/plant
|
|
LQ
|
43.6ª.C.1
|
272.2ª.B
|
441.9ª.A
|
85.40
|
758.6ª
|
|
JI
|
46.7ª.B
|
150.5b.A
|
203.3b.A
|
85.78
|
400.5b
|
|
1
|
differentlo
|
wercase letters
in
|
the same column
|
(t Student test)
and
|
uppercase letter
|
in the same
|
row (Student-Newman-Keuls test),
are significantly (P<0.05) different;2 least significant difference according
to Student-Newman-Keulstest..
.Ayerza.final_archivos/image012.png)
Table 5. Mean jojoba productions from the LQ
and JI sites at 3, 4
and 5 years of age.
plants it is related to the increase of biomass
volume (Jiménez-Méndez et al., 2019; Fan et al.,
2020).
Undoubtedly, the LQ site was significantly (P<0.05) more productive than the JI (Table 5). Taking the yield of the LQ site to one hectare after five years means production of 995 kg/ha (2,500 plants – 10% of male plants
= 2,250 female plants/ha), which is within
the yields achieved at that age in commercial
plantations originating from seeds in Mexico, the US and the current area of commercial production in Argentina, in the Province of La Rioja (Ayerza, 2016, 2020b).
The mean yields reached
in the fifth year were higher than the mean attained in Riverside, California, USA, in plantations originating from seed and with irrigation (Ayerza, 1989).
But in the third year they were lower than the media obtained
from three- year-old
plants from seeds in Hermosillo, Sonora, Mexico, under
irrigation conditions (Ramonet
& Morales, 1985).
The mean of the eight three-year-old clones
implanted under irrigation conditions in the Table 5 shows that the comparative production between sites determined productions without significant difference (P<0.05) in 1983, while in 1984 and 1985 the production of the LQ plants was significantly
(P<0.5) higher than those of JI. The lack of statistical significance (P<0.05) between
the productions of 1983 in both sites, may be due to the presence
of frosts in June and July (Table 2). Although
they were lower in LQ, one degree Celsius
below zero is enough to kill
open flowers (Ayerza, 1990a).
In 1984 and 1985, frost occurred early in JI but not in LQ, thus justifying the productive differences between sites.
Milthorpe and Dunstone (1989) found that genotypes that broke dormancy
late were more likely to survive frost events. The variability in the floral opening date of the different genotypes has been demonstrated on the slope where the original
seeds were collected (Buchmann, 1987).
The
potential, resorting to the cloning and use of the superior genotype, in the fifth
year represents productions of 2,900 kg/ha for the LQ site (Q3P2) and 767 kg/ha
for the JI (J4P5). The projection of the LQ production is higher than the mean
of 954 kg/ha, mean 2010-2019, and even the 1,363 kg/ha of the year 2015, which
was the one with the highest mean production, of the adult Argentine commercial
plantations maintained under irrigation in La Rioja (Ayerza, 2020b).
However, it is far from the maximum yields achieved in Israel
(7,070 kg/ha) (Perry et al., 2021) or Aimogasta (5,000 kg/ha) (Norberto Vinelli,
personal communication, Aimogasta,
La Rioja, Argentina, 2023) in adult plantations of clones with
drip irrigation and fertilization.
Q4P8 and J3P22were the plants with the highest accumulated
production of the analyzed three years with 1,805 g and 1,386 g/plant
respectively (Tables 3 and 4). The
productive difference determined between the LQ and JI sites,
considering only the production of the most productive plant in the fifth year,
significantly decreased in favor of
|
Month
|
J
|
F
|
M
|
A
|
M
|
J
|
J
|
A
|
S
|
O
|
N
|
D
|
Total
|
SD
|
|
Rainfall (mm)
|
|
LQ-83
|
398
|
0
|
17
|
26
|
0
|
0
|
0
|
31
|
29
|
65
|
76
|
85
|
727
|
115.63
|
|
LQ-84
|
197
|
106
|
63
|
6
|
0
|
0
|
0
|
0
|
48
|
2
|
20
|
212
|
654
|
62.45
|
|
LQ-85
|
100
|
0
|
62
|
11
|
0
|
0
|
110
|
36
|
0
|
7
|
82
|
96
|
504
|
43.59
|
|
SD
|
151.9
|
61.20
|
26.27
|
10.41
|
0.00
|
0.00
|
63.51
|
19.50
|
24.17
|
35.02
|
34.20
|
70.36
|
|
37.36
|
|
Mean
|
231.7
|
35.3
|
47.3
|
14.3
|
0.0
|
0.0
|
36.7
|
22.3
|
25.7
|
24.7
|
59.3
|
131.0
|
628.3
|
73.9
|
|
JI-83
|
322
|
51
|
6
|
16
|
0
|
0
|
13
|
26
|
26
|
54
|
62
|
88
|
664
|
88.35
|
|
JI-84
|
189
|
104
|
59
|
6
|
0
|
0
|
0
|
0
|
44
|
2
|
25
|
218
|
647
|
77.02
|
|
JI-85
|
104
|
72
|
54
|
8
|
0
|
0
|
107
|
27
|
0
|
10
|
85
|
62
|
529
|
41.57
|
|
SD
|
109.8
|
26.69
|
29.26
|
5.29
|
0.00
|
0.00
|
58.39
|
15.31
|
22.12
|
28.00
|
30.27
|
83.58
|
|
24.40
|
|
Mean
|
205.0
|
75.7
|
39.7
|
10.0
|
0.0
|
0.0
|
40.0
|
17.7
|
23.3
|
22.0
|
57.3
|
122.7
|
613.3
|
69.0
|
|
EC-83
|
369
|
46
|
11
|
19
|
0
|
14
|
14
|
29
|
28
|
57
|
65
|
82
|
734
|
100.04
|
|
EC-84
|
190
|
112
|
52
|
5
|
0
|
0
|
0
|
0
|
44
|
2
|
21
|
216
|
642
|
77.50
|
|
EC-85
|
105
|
68
|
46
|
10
|
0
|
0
|
107
|
0
|
0
|
12
|
102
|
64
|
514
|
44.66
|
|
SD
|
134.7
|
33.61
|
22.14
|
7.09
|
0.00
|
8.08
|
58.16
|
16.74
|
22.27
|
29.30
|
40.55
|
83.05
|
|
27.85
|
|
Mean
|
221.3
|
75.3
|
36.3
|
11.3
|
0.0
|
4.7
|
40.3
|
9.7
|
24.0
|
23.7
|
62.7
|
120.7
|
630.0
|
74.1
|
Table 6.
Rainfall by site
and year.
LQ. Thus, production
of JI went from 26% to 77% concerning LQ.
These productions were obtained
without irrigation, with the annual rainfall
shown in Table 6. The data show that the maximum
difference in rainfall
between sites occurred in 1983 with 10% in favor of the LQ site. The distribution of rainfall was typical
of the Chaco region, with a hot and rainy season and a temperate
and dry season. The rainfalls of June and August 1984 must be considered an anomaly in the Arid Chaco
(NCEI, 2022).
The rainfalls
of the three studied
years agree with the mean values of the period 1970- 2011 (673 mm) in Villa Dolores, Córdoba,
30 km south of El Desafío, on the foothills
of the Sierras de los Comechingones. Thus, they also agree with the mean
for the period 1973- 2003 (512 mm) measured in the Chancani Forest Reserve,
on the foothills of the Sierra
de Pocho, 24 km north of El Desafío (Iglesias et al., 2010; Karlin,
2012).
Rainfalls measured in this work were 45% above the mean of 433 mm obtained
in Superior, Arizona, in the northern limit of the Sonoran Desert, considered one of the most productive areas of native jojoba
(Ayerza, 1990a).
Except the LQ weights
for 1983 and 1985, the individual seed weights obtained
for both sites (Table 7) were higher than those determined as the mean of the germplasm
collection of the native stands of the species in their areas of origin: Sonoran Desert,
|
Site
|
1983
(g/seed)
|
1984
|
1985
|
LSD2
|
Total
(g/seed)
|
|
LQ
|
0.70b.B.1
|
0.83ª.A
|
0.73b.B
|
0.05
|
0.76b
|
|
JI
|
0.79ª.B
|
0.82ª.B
|
0.93ª.A
|
0.07
|
0.85ª
|
1differentlowercase letters
in the same column (t Student
test) and uppercase letter
in the same row
(Student-Newman-Keuls test), are significantly (P<0.05) different; 2 least significant difference according
to Student-Newman-Keuls test.
.Ayerza.final_archivos/image013.png)
Table 7. Mean weight of the seeds produced in
LQ and JI at 3, 4
and 5 years of
age.
.Ayerza.final_archivos/image014.png)
Year 1983 1984 1985 Media SD LSD4
Plant (%
of wax2)
|
Q P
3
2
|
52.9
|
53.2
|
51.2
|
52.4ab3
|
1.08
|
---
|
|
Q P
3
6
|
49.8
|
52.4
|
50.6
|
50.9ab
|
1.33
|
---
|
|
Q P
3
8
|
40.6
|
51.9
|
49.7
|
47.4b
|
5.99
|
---
|
|
Q P
3
10
|
49.7
|
52.8
|
49.7
|
50.7ab
|
1.79
|
---
|
|
Q P
4
8
|
55
|
53.5
|
50.8
|
53.1ª
|
2.13
|
---
|
|
Q P
4
10
|
49.7
|
52.8
|
49.7
|
50.7ab
|
1.79
|
---
|
|
Q P
6
10
|
50.9
|
53.4
|
52.3
|
52.2ab
|
1.25
|
---
|
|
Mean
|
49.8b.3
|
52.9ª
|
50.7ªb
|
51.1
|
---
|
3.61
|
|
SD1
|
4.52
|
0.57
|
0.98
|
1.87
|
---
|
---
|
|
LSD4
|
---
|
---
|
---
|
4.74
|
---
|
---
|
|
JI 5
1
|
---
|
---
|
---
|
51.7
|
---
|
---
|
|
JI 5
2
|
---
|
---
|
---
|
51.1
|
---
|
---
|
|
Mean
|
---
|
---
|
---
|
51.4
|
---
|
---
|
|
SD1
|
---
|
---
|
---
|
0.42
|
---
|
---
|
1Standard deviation;2 percentage on the dry weight
of the seed; 3 different letters in the same column or row
are significantly (P<0.05) different
according to Student-Newman-Keuls
test; 4 least significant difference; 5years and
plants sample; LQ n = 3.
.Ayerza.final_archivos/image015.png)
Table 8.
Variability of wax content between
years and between genotypes.
Californian
Mediterranean and Los Cabos Tropical Region. This was 0.56 g (0.36 – 0.75g/plant)
measured at 4% seed moisture (Ayerza,1990b). The variability of the individual seeds’ weight between
years is affected by climatic
conditions (Goytia- Jiménez et al., 2011), which may be the explanation for the indicated
variations. The significant
difference (P<0.05) between
the individual weights of LQ and JI cannot be explained with the available information.
The wax content
of seven plants chosen
at random from the LQ site (Table 8) showed yields
between 40.6% and 55%, depending on the genotype and the year. Through
the
their interactions, both in jojoba and in other species, viz., moringa
and olive (Dunstone et al.,
1985; Ayerza, 2011, 2020b; Nissim et al., 2020), which could justify the differences measured in this work.
Open
pollination and the availability of pollen from different male plants in jojoba
plots also influence the variability of the wax content of the seeds
from different plants
of the same clone, in the same site and year. This was demonstrated in the foothills of the Sierra de Ancasti, Catamarca,
Argentina (Ayerza, 2020b)
and Ramat Negev, Israel (Benzioni
& Vaknin, 2002).
The standard deviation magnitude of the
wax percentage of the three measured years (Table 8)
shows a great dispersion between genotypes for 1983 and within each genotype through
the years. The standard deviation of the Q3P8 genotype showed the highest comparative
variability.
The mean
annual wax production of the LQ plant seeds (Table 8) was significantly (P<0.05)
higher in 1984, compared to that of 1983, and also 1985, although in the latter
case
the
difference was not significant (P<0.05). It has been shown that the
percentage of jojoba wax increases when the fruiting process starts early
(Perry et al., 2021). The year
with the
highest wax content was 1984, with no frost interfering with the beginning and development
of the fruiting period (Table 2).
On the other
hand, the JI1 and JI2 composite samples (Table 8), with liquid wax yields of 51.70%
and 51.10% were within the limits obtained from the LQ plants.
The wax percentages
obtained here agree with those reported by other authors in seeds collected from
wild plants in different regions of the Sonoran Desert and the Californian Mediterranean
ecosystem. Araiza-Lizarde et al. (2017) reported for seeds collected in three locations
in Mexico, Sonoyta, Todos Santos and La Huerta,
(49 ± 2.80), (44 ± 1.35) and
(43 ±
1.00) %, respectively. Miwa (1971) determined 48.4%and 40.5% for two sites in Arizona,
and for the Californian Mediterranean ecosystem,
52,5% in inland stands and 49.4% in plants located
on the coast; Ayerza (1990b)
in wild jojoba plants
located in 8 sites in Arizona, 3 in Baja California, 4 in Baja California Sur, 3 in California and 2 in Sonora,
obtained a mean of 48.9% and extremes
of 45% and 53%.
Regarding their comparison with the wax decreases the extreme minimum
temperatures when ascending the slope.
The intensity of this effect
decreased as the altitude
descended, making the autumn-winter thermal
regime inadequate for jojoba below 400 masl.
ACKNOWLEDGMENTS
The author acknowledges support for this project
from Quitral-co SAIC, Buenos
Aires, Argentina and International Flora Technologies, Chandler, Arizona, U.S.A
CONCLUSIONS
These results
contribute to understanding the ecosystem conditions where jojoba
was planted in Argentina, explaining its persistence 40 years later.
The work surveyed
the climatic conditions that allowed its planting and development in the ecotone
between the Arid Chaco and the
Mountain Chaco, between 550 and 400 meters above sea level, in the foothills of
the Sierra de Pocho, Córdoba, whose slope allows a suitable strip 2.4 km wide.
The presence of the atmospheric phenomenon of autumn-winter thermal inversion
in the Sierra de Pocho foothills was determined as the factor of the
persistence and production of jojoba. This phenomenon decreases the extreme minimum
temperatures when ascending the slope. The intensity of this effect decreased
as the altitude descended, making the autumn-winter thermal regime inadequate
for jojoba below 400 masl.
REFERENCES
AOCS. (1984). Official methods of AOCS. Official
Methods and Recommended Practices of the American Oil Chemists Society.
First Edition, American Oil Chemists´ Society, Champaign, Illinois, U.S.A.
Araiza-Lizarde, N., Alcaraz-Meléndez, L., Angulo-
Escalante, M. A., Reynoso-Granados, T., Cruz-Hernández, P., &
Calderón-Vázquez, C. L. (2017). Physicochemical Composition of Seed Oil of Wild
Jojoba Populations in Northwestern Mexico. Journalof Food and Nutrition
Research, 5(6), 443-450.
Ayerza, R. (1990a). La Jojoba: ecología, manejo y
utilización. Orientación Gráfica Editora. Buenos
Aires, Argentina.
Ayerza, R. (1990b). Variabilityof oil content
in jojoba (Simondsia chinenesis L.[Schneider]) seeds
harvested in the Sonoran
desert. In Proceedings of
the 8th International Conference on Jojoba and Its Uses, and 1st International Conference on Promising
Crops for Arid and Semi Arid Lands (pp.
200-205). Latin America Jojoba Association and Jojoba
Growers Association. Asunción, Paraguay.
Ayerza, R. (1992).
Deficiente vernalización de la jojoba
en el Chaco Paraguayo.Gaceta Agronómica, 12(68), 264-268.
Ayerza, R. (2001). Seed wax ester composition of ten jojoba clones growing
in two arid ecosystems of South America. Tropical Science,
41, 1-4.
Ayerza, R. (2004). Polinización de la jojoba
en Catamarca: comparación de los años 2002 y 2003. Fincas de Ambato
S.A. Catamarca, Argentina.
Ayerza, R. (2011).
Seed’s yield components, oil content, and fatty acid composition of two
populations of Moringa (Moringa oleifera Lam.) growing
in the Arid Chaco
of Argentina. Industrial Crops and Products, 33, 389-394.
Ayerza, R. (2016). Case studies
- Jojoba, new industrial crop development and commercialization in Argentina. In Proceedings of the International Workshop on Olive and Jojoba
(pp. 1-14). State Institute
of Agriculture Management, Government of Rajasthan, Jaipur, India,
Ayerza, R. (2020a).
Producción anual de semilla de jojoba en Argentina: Período 1999-2020. In 20ava, Reunión Argentina
de Productores de Jojoba (pp. 1-2). Aimogasta, La Rioja, Argentina.
Ayerza, R. (2020b). Variability
in oil content in Argentine jojoba. Revista
Mexicana de Ciencias
Agrícolas, 11(4), 841-852.
Ayerza, R. (2023). Variation of Temperatures, Rains and Winds, Related
to the Altitude in an Eco-tone
between the Mountain Chaco and the Arid Chaco. Revista
Industrial y Agrícola
de Tucumán, 100(1),
37-45.
Ayerza, R. (2025). Jojoba: ecology and development in the Sonoran Desert: 50 years of history. Editorial Hecho a Ojo LLC. La Rinconada, Santa Elena, Ecuador.
Ayerza, R., & Zeaser, D. (1987).
Evaluation of two origins of jojoba from production. In Proceedings of the II Australian Jojoba
Association Seminar (pp.
5-7). Australian Jojoba
Booklet. Perth, Australia.
Bates R. G. (1973).
Determination of pH. Theory and practice. 2nd.
Ed. Wiley. New York,
U.S.A.
Benzioni,
A., Palzkill, D. A., & Nelson, J. M.
(1992). Flower Bud Dormancy, ABA Concentration, and Survival
during Frost of Jojoba Genotypes under Water Stress.
Journal of the American Society
for Horticultural Science, 117(6), 976-980.
Benzioni,
A., & Vaknin, Y. (2002).
Effect of Female
and Male Genotypes
and Environment on Wax Composition in Jojoba.
Industrial Crops and Products,10(2),
85-95.
Bocco, M., Coirini, R., Karlin, U., & von Müller,
A. (2007). Evaluación
Socioeconómica de Sistemas Productivos
Sustentables en el Chaco Árido, Argentina. Zonas Áridas
11(1), 70-84.
Bravo, R., Muñoz, M.,
& Quintana, J. (2020). Heladas. Factores
atmosféricos, tendencias y efectos en frutales y vides. Instituto de Investigaciones Agropecuarias (INIA).
Boletín N° 417. Osorno, Chile.
Bray, R. H., & Kurtz, L. T. (1945). Determination of total, organic
and available forms of phosphate in soils. Soil Science,
59, 39-45.
Brooks,
W. H. (1978). Jojoba
a North American
desert shrub; its ecology, possible
commercialization, and potential
as an introductory species into other arid regions. Journal of Arid Environnment, 1,
227-236.
Buchmann, S. L. (1987). Floral Biology of Jojoba (Simmondsia chinensis), an Anemophilous Plant. Desert Plants,
8(31), 111-124.
Burden, J. D. (1970).
Ecology of Simmondsia chinensis (Link) Schneider
at its lower evational limits. Thesis Master of Science. Arizona State University, Tempe, Arizona, U.S.A.
Chapman H. D.& Pratt,
P. F.
(1961). Methods of Analysis for Soils, Plants, and Waters. University of California. Riverside, California, U.S.A.
Coates,
W., & Ayerza, R. (2008). Supplemental pollination-increasing jojoba (Simmondsia
chinensis L. [Schneider]) seed yields in the Arid Chaco environment. Industrial Crops and Products, 27(3), 364-370.
Cohort Stat (2006). Cohort Stat 6.311. Cohort Software Inc. Monterey,
California, U.S.A.
Díaz Queralto,
F. (1971). Práctica de la defensa
contra heladas. Dilagro,
Lérida, España.
Dunstone, R. L. (1980).
The reproductive cycle in jojoba.
In A. R. Baldwin (Ed.). Proceedings of the Seventh International Conference on Jojoba and Its Uses. American Oil Chemists’
Society (pp. 50-59). Champaign, Illinois, U.S.A.
Dunstone,
R. L. (1995). Predicting flowering time in different genotypes of jojoba. Effect of Temperature on the Synthesis of Jojoba
Wax. Australian Journal of Plant Physiology, 12,
355-362.
Durazo, U.
(1982). Estabilidad y Media de Producción en Plantas
de Jojoba, Simmondsia chinensis
(Link) Schneider, Bajo Cultivo en la Costa de Hermosillo. In A. E. Cesnik
(Ed.), Proceedings of the Fifth International Conference on Jojoba and Its Uses (pp.
237- 244). Office of Arid Lands Studies, University of Arizona. Tucson, Arizona, U.S.A.
Fan, Z., Xiong,
H., Luo, Y., Wang, Y., Zhao, H., Li, W., He, X., Wang, J., Shi, X., & Zhang, Y. (2020).
Fruit Yields Depend on Biomass and Nutrient
Accumulations in New Shoots
of Citrus Trees. Agronomy,10, 1988. https:// doi.org/10.3390/agronomy10121988
Ferriere, J., Milthorpe, P. L., & Dunstone, R. L. (1989).
Variability in chilling requirements for the breaking
of flower bud dormancy in jojoba (Simmondsia chinensis
[Link] Schneider). Journal of
Horticultural Science, 64(3), 379-387.
Gentry, H. S.
(1958). The natural history of jojoba (Simmondsia chinensis) and its cultural aspects.
Economic Botany, 12, 261-295.
Goytia-Jiménez, M. A.,
Gallegos-Goytia, C. A., & Núñez-Colín, C. A. (2011). Relación entre variables climáticas con la morfología y contenido de cera de semillas de higuerilla (Ricinus communis L.) de Chiapas. Revista Chapingo Serie Ciencias Forestales y del Ambiente,
17(1), 41-48.
Grand View Research.2023. Jojoba
Oil Market Size, Share & Trends Analysis Report By Type, By Application (Cosmetics & Personal
Care, Pharmaceutical), By Sales
Channel (B2B, B2C), by Region,
and Segment Forecasts, 2023 – 2030.
Dowload on May 30, 2023. https://www.grandviewresearch. com/industry-analysis/jojoba-oil-market [accessed: May 2023].
Hang, S., Mazzarino, M. J., Núñez, G., & Oliva,
L. (1995). Influencia del desmonte selectivo sobre la disponibilidad de nitrógeno en años húmedos
y secos en sistemas silvopastoriles en el Chaco Árido Argentino. Agroforestería de las Áméricas,
2(6), 9-14.
Iglesias, M. R., Barchuk, A., & Grilli, M. (2010),
Dinámica estacional e interanual del NDVI en bosques
nativos de zonas áridas argentinas. Revista de Teledetección, 34, 1-11.
IMARC Group. (2023). Jojoba Oil Market:
Global Industry Trends, Share, Size, Growth,
Opportunity and Forecast
2023-2028. Download
on May 20, 2023 from https:// www.imarcgroup.com/prefeasibility-report- jojoba-oil-processing-plant
Jiménez-Méndez, A., Guerrero-Peña, A., García- López, E., & Carrillo-Ávila, E. (2019). Producción de biomasa total, rendimiento
y composición de la semilla de Jatropha
curcas L. con diferentes dosis de fertilización. Interciencia, 44(9), 529-534.
Karlin, M. S. (2012).
Cambios temporales del clima en la subregión del Chaco Árido. Multequina, 21, 3-16.
Karlin, M. S. (2013).
Suelos. In R. O. Coirini,
M.
S. Karlin,
U. O. Karlin, G. J. Reati and R. M. Zapata (Eds.).
El Chaco Árido (pp.
51-77). Universidad Nacional de Córdoba. Córdoba,
Argentina.
Kour, D., Bakshi, P., Wali, V. K., Sharma, N., Sharma,
A., & Iqbal,
M. (2018). Alternate Bearing
in Olive - A Review International Journal of Current Microbiology and Applied
Sciences,7(9), 2281-2297. https://doi. org/10.20546/ijcmas.2018.709.283
Lavee, S. (2007). Biennial bearing
in olive (Olea europaea). Annales. Series
Historia Naturalis, 17(1), 101-112.
Lazare, S. Zipori,
I., Cohen, Y., Haberman, A., Goldshtein, E., Ron, Y., Rotschild, R., & Dag, A. (2021). Jojoba pruning: New practices
to rejuvenate the plant, improve
yield and reduce alternate bearing. Scientia Horticulturae, 277, 109793. https://doi.org/10.1016/j. scienta.2020.109793
Livingston, D.
P. (2018). Investigating Freezing Patterns in Plants Using Infrared Thermography. In M. Iwaya-Inoue, M, Sakurai
& M. Uemura (Eds.). Advances in Experimental Medicine and Biology,
Survival Strategies in Extreme Cold and Desiccation, Advances
in Experimental Medicine and Biology (pp. 117-127).
Springer Nature Singapore Pte Ltd.
Mehlich, A.
(1984). Mehlich-3 soil test extractant: a modification of Mehlich-2 extractant. Communications in Soil Science
and Plant, 15, 1409-1416.
Medina Morales, M. C., Samaniego-Gaxiola, J. A., Santamaría-César, J., Faz-Contreras, R., Herrera-Pérez, T., Ramírez-Delgado, M., &
González- Cervantes, G. (2000). Alternancia en la producción del nogal pecanero, en la comarca lagunera de México. ITEA, 96(2), 132-138.
Milthorpe, P. L. (2006).
Evaluation of jojoba
germplasm in different environments. A report
for the Rural Industries Research
and Development Corporation, RIRDC Publication No 05/184.
Australian Government, Condobolin, New South Wales, Australia.
Milthorpe, P. L., & Dunstone,
R. L. (1989). The potential of jojoba (Simmondsia chinensis) in New South Wales 2. Some factors
affecting yield. Australian Journal of Experimental Agriculture, 29, 389-395.
Miwa, T.
(1971). Jojoba Oil Wax Esters and Derived
Fatty Acids and Alcohols:
Gas
Chromatographic Analyses. Journal
of the American Oil Chemists’
Society, 48(13), 259-264.
Montesinos-Torres, D. (2007). Juniperus thurifera: una especie
dioica, vecera y relíctica.
Ecosistemas,16(3), 172-185.
Nahla, A., Adawy, S., Eliraq,
M., Abo-El-Khasab, A., Abd-El-Aziz, Y., El-Bassel, E., Esmail,
A.
S., Attaia, M., Darwish, S. H., El-Ashry, H., &
Gawish, M. S. (2018).
Selection and Agronomical Evaluation for Some Elite Genotypes
of Jojoba. Journal of Applied Life Sciences International, 18(1), 1-12.
Nelson, J. M., & Palzkill, D. A. (1993). Irrigation effects on growth, cold tolerance of flower
buds, and seed yield of jojoba. In J. Janick and
J. E. Simon (Eds.), New crops (pp.
360-362),
Wiley, New York,
U.S.A.
NCEI- National Centers for Enviromental Information. 2022. Global Summary of the Month
(GSOM), Version 1.
https:// www.ncei.noaa.gov/access/search/ data-search/global-summary-of-the- month?dataTypes=PRCP&bbox=-28.663,- 67.606,-30.163,-66.106&startDate=1968-12-
13T00:00:00&endDate=1968-12-13T23:59:59
Nerd, A., & Benzioni,
A. (1988). Effect of water status, genetic background gender
and fertilizer on flowering
in jojoba. Advances in Horticultural Science,
2, 48-51.
Nissim, Y., Shloberg, M.,
Biton, I., Many, Y., Doron-Faigenboim, A., Zemach, H., Hovav,
R., Kerem, Z., Avidan,
B., & Ben-Ari,
G. (2020). High temperature environment reduces olive oil yield and quality. PLoS One,23, 15(4), e0231956. https://doi.org/10.1371/journal.pone.0231956
Palzkill, D. A., &
Hogan, L. (1982).
Jojoba seed yield from a seedling planting
at Mesa, Arizona,
and from a cutting-grown planting near Bakersfield, California. In Proceedings of the Fifth International Conference on Jojoba and Its Uses, (pp. 231-236).
Office of Arid Lands Studies,
University of Arizona.
Tucson, Arizona.
Perry, A., Tel-Zur, N., & Dag, A. (2021).
Vegetative and Reproductive Response
to Fruit Load in Two Jojoba (Simmondsia chinensis) Cultivars. Agronomy11(5), 889.
https://doi.org/10.3390/ agronomy11050889
Ramírez-Santa-Pau, M. M. (2001).
Variabilidad de la producción en olivo (Olea europaea L.). relación entre alternancia, floración, vigor y productividad. Tesis Doctoral,
Universidad de Córdoba, Córdoba,
España.
Ramonet, R., & Morales, A. M. (1985).
Seed yield variability and selection
criterion of jojoba clones
in Mexico. In Proceedings of the Sixth
International Conference on Jojoba and Its Uses. (pp. 279-286).
University of The Negev. Beer-Sheva, Israel.
Ramonet, R. (1988): Selection criteria
and evaluation procedures for jojoba plant improvement. In Proceedings of The Seventh International Conference on jojoba and its Uses. (pp. 60-68.).
American Oil Chemists
Society, Phoenix, Arizona, U.S.A.
Shreve, F.
(1912). Cold air drenaje. Plant
World,
15, 110-115.
Snyder, R. L., &
de Melo-Abreu, J. P. (2005). Frost Protection: fundamentals, practice, and economics. Food andAgriculture Organization of the United Nations. Rome, Italy.
Tálamo, E., Moya-Ruíz, F., García, R., Rocha- Fasola,V., & López,
F. R. (2013). El Complejo
Acuífero Profundo de Arauco,
provincia de La Rioja. In N. González,
E. E. Kruse, M.
M. Trovatto, & P. Laurencena (Eds.). Agua subterránea recurso estratégico. (pp. 140- 147). Editorial de la
Universidad de La Plata. La Plata, Buenos Aires, Argentina.
Tel-Zur, N., Rothschild, R., Zurgil,
U., & Vaknin,
Y. (2020). Characterization of Flowering
Time and Pollen
Production in Jojoba
(Simmondsia chinensis) towards a Strategy
for the Selection of Elite Male Genotypes. Agronomy,10, 592. https://doi.org/10.3390/agronomy10040592
Tobares, L., Frati, M., Guzmán,
C., & Maestri, D. (2004).
Agronomical and chemical
traits as descriptors for discrimination and selection
of jojoba (Simmondsia chinensis) clones. Industrial Crops and Products,
8, 145-149.
United Nations. (2019). Informe de políticas de ONU-AGUA
sobre el Cambio Climático
y el Agua. UN Water-United Nations. Geneve, Suisse.
U.S. Army Corps of Engineers. (1997).
Agronomical and chemical
traits as descriptors for discrimination and selection
of jojoba (Simmondsia chinensis) clones. Tucson area drainage study, AZ (Tucson
Arroyo) Feasibility study phase feasibility report and environmental impact statement.
U.S. Army Corps of Engineers. Los Angeles,
California, U.S.A.
Walkley, A., & Black, I. A. (1934).
An examination of the Degtjareff method for determining organic carbon
in soils: Effect
of variations in digestion conditions
and of inorganic soil constituents. Soil Science, 63, 251-263.
Wünsche, J. (2021).
Physiological, metabolic
and molecular basis of biennial bearing n apple. Horticulture Innovation Australia. Sydney, New South Wales, Australia.
Yermanos, D. M. (1982). Jojoba
out of the Ivory Tower and into the real world of agriculture. University of California. Riverside, California, U.S.A.
Yermanos, D. M. & Duncan, C. C. (1976).
Quantitative and qualitative characteristics of jojoba seed. Journal of the American
Oil Chemists’ Society,
53, 80-82.